Räuber & Beute
 |
|
|
 A software to calculate, display and manipulate predator prey population dynamics. The program
supports English (default) or German.
A software to calculate, display and manipulate predator prey population dynamics. The program
supports English (default) or German.
This software is for educational purpose and suitable for school and lower university classes.
Don't hesitate to contact me for further information!
 Ein Programm zum Berechnen, Anzeigen und Manipulieren
der Populationsdynamik in einem einfachen Räuber-Beute-System. Die Programmoberfläche unterstützt englisch (Standard)
und deutsch. Nicht alle Teile der Anleitung sind auf deutsch verfügbar.
Ein Programm zum Berechnen, Anzeigen und Manipulieren
der Populationsdynamik in einem einfachen Räuber-Beute-System. Die Programmoberfläche unterstützt englisch (Standard)
und deutsch. Nicht alle Teile der Anleitung sind auf deutsch verfügbar.
Diese Software ist für Lehrzwecke gedacht und geeignet für Schul- und untere Universitätsklassen.
Bei Rückfragen, Anregungen, Wünschen einfach das Kontaktformular nutzen!
--
Table of Content - Inhaltsverzeichnis
Welcome - a brief introduction about the program
License - terms of use
Requirements - what is needed to run this program?
Installation - installation of the program
Usage - how to use the programm
Download - get your copy here
FAQ - frequently asked questions
History - history and future develoment
Welcome - Willkommen
Räuber & Beute
is a software that computes
and displays the predator prey population relation. The core of
the program is based on the Lotka-Volterra algorithm. But it is also enhanced with a few
environement parameters.
The dynamics are calculated for a given habitate which is in lose contact to neighbor habitates
(a limited migration is possible). The simulation is assuming simplified years. Prey can
breed once or twice a year, predators once. Lethality is higher during winter. Winters can be
normal or tough ("icewinter").
Also a simplified virus epedemia (prey or predator) can get elicited manually. The virus infection dynamics
is based heavily on popuation density, but there are also a few random parameters (lethality). Usually the virus
infection follows a bell shaped course.
Many parameters can be manipulated in real time (see usage).
As of yet the program language is English or German with English being the default language.
The program is probably of educational and/or scientific interest only.
Räuber & Beute ist ein Programm zum Berechnen, Anzeigen und Manipulieren
der Populationsdynamik in einem einfachen Räuber-Beute-System. Grundlage des Programms ist der
Lotka-Volterra-Algorithmus. Es ist darüberhinaus mit ein paar Umweltparametern erweitert.
Die Dynamik wird für ein gegebenes Habitat berechent, das in lockerem Kontakt zu Nachbarhabitaten
steht, so dass eine begrenzte Migration möglich ist. Die Simulation legt ein vereinfachtes Jahr zu
Grunde. Beutetiere können sich einmal oder zweimal pro Jahr fortpflanzen, Räuber einmal. Die
Sterblichkeit ist im Winter höher als im Sommer, Winter können normal oder streng sein
("Eiswinter"). desweiteren können einfache Virusepedemien (Räuber oder Beute)
manuell ausgelöst werden. Der Verlauf der Virusepedemie basiert,ergänzt um einige Zufallsparameter (Lethalithät des Virus),
stark auf der Populationsdichte. Der Verlauf der Infektionsrate ist meist glockenförmig.
Viele Parameter der Simulation können in Echtzeit verändert werden, Daten können als Grafikdatei abgespeichert werden.
Das Programm unterstützt Deutsch und Englisch als Sprache, wobei Englisch die Standardsprache auf
allen nicht deutschsprachigen Systemen ist.
Das Programm ist wahrscheinlich nur von didaktischem und/oder wissenschaftlichen Interesse.
This software is free for personal use. You may use it on your own risk. You are free
to copy and distribute the archive. When
distributing and/or spreading the program you must not:
I am happy for any feedback though.
Dieses Programm ist frei zur privaten Nutzung. Nutzung auf eigene Gefahr.
Es ist erlaubt das Archiv zu kopieren oder zu verteilen. Wenn es angeboten oder
verteilt wird darf nicht:
This software is written in the language Hollywood and hence available for many systems, either
as native application or as .hwa-applet code. There is no additional
software required and it should run on any computer running one of the supported operating
systems. Be sure, you have downloaded the program version for your particular operating system.
You may need a processor
better not less than 400 MHz and a few MB of available RAM as well as a screen
resolution of at least 1024*600 pixels and minimum 16 bit colour depth.
Once you've downloaded the archive, unpack it and copy it to any destination you like (target drive needs at least 2.3 MB free space). You may put it on your harddsik, on a usb key or even on a server. There is no special installation process required.
Just doubleclick the program icon. Once the splash screen has vanished the program starts
with three windows: the control panel (shown below), the
running average data of a 1 year period
and the actual "real time" population dynamics.
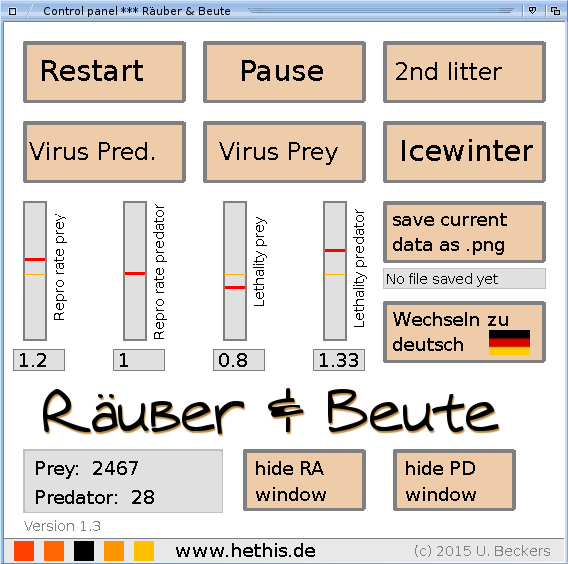
The program starts in a halted mode. To run the actual
simulation you need to click on the Pause button within the control panel.
Just play around with the buttons and sliders to change parameters of the prey predator dynamics.
Buttons:
Sliders
At the bottom of the control panel window the current population of prey is continuously given as actual number as well as the population of predators.
Below the "save current data as .png" the number of the last saved file is given. The files are saved to a directory called "RB-files" which is automatically generated at the actual directory the binary resides in. Each click on the save button will save two files: one for the running average (the file names follow this scheme: RAv_currentdate_currentnumber.png). and one for the population dynamics (the file names are following this scheme: RTime_current date_currentnumber.png). The RT .png-file has the last prey/predator numbers written to the bottom of the picture. On startup the program detects whether files of the current date are existing already and - if files exist - does apply the actual next number to the file name.
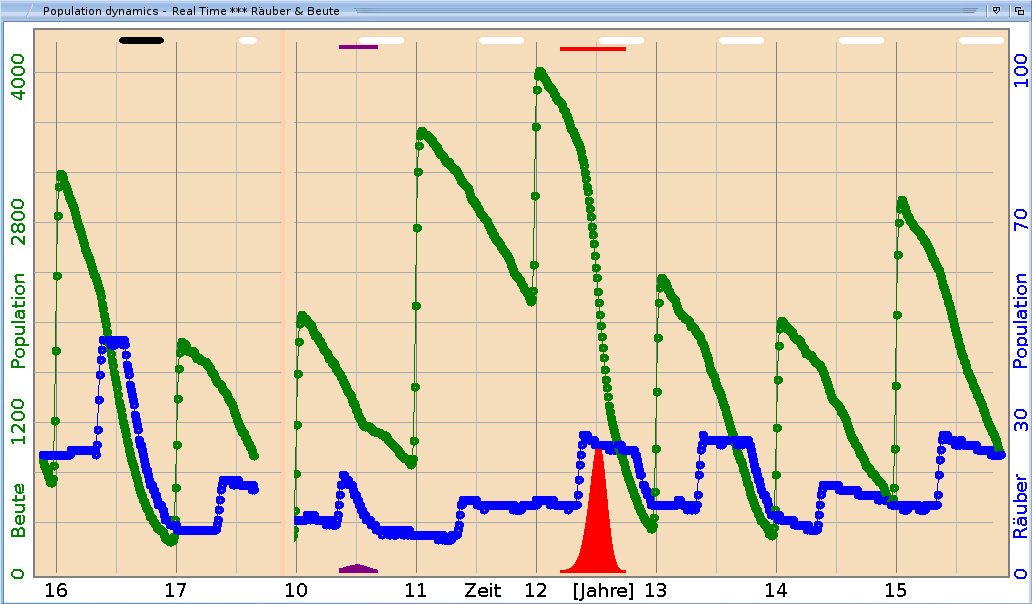
There are two graphs displaying the population of the predators (blue) and prey (green) over time. One as a detailed actual population monitor ("real time" population numbers). This is shown at the larger graph window (titled "Population dynamics - Real Time" and may look like shown below.
|
The vertical resolution (number of individuals) is not identical for prey and predators.
The distance between two horizontal lines is 400 for prey and 10 for predators.
Each 2nd thin vertical line (dark grey) denotes the beginning of a
virtual year (drawing eastate is sufficient for 8 years), the horizontal thick lines at
the top area denote the virtual winter time. White indicates a normal winter, black
an "Icewinter" (stronger winter). Thin vertical lines denote a
virus outbreak. A virus infectious for prey is marked by a red line, for predators
the line is purple. Additionally at the bottom of the window the infection rate is given.
Infection rate and course depends on several parameters, most important the size of the
population. Once the drawing estate is filled for the first time all data gets continuously
overwritten by new data. Right sided to the redly tinted cursor there's old data and leftly behind
that cursor new data appears.
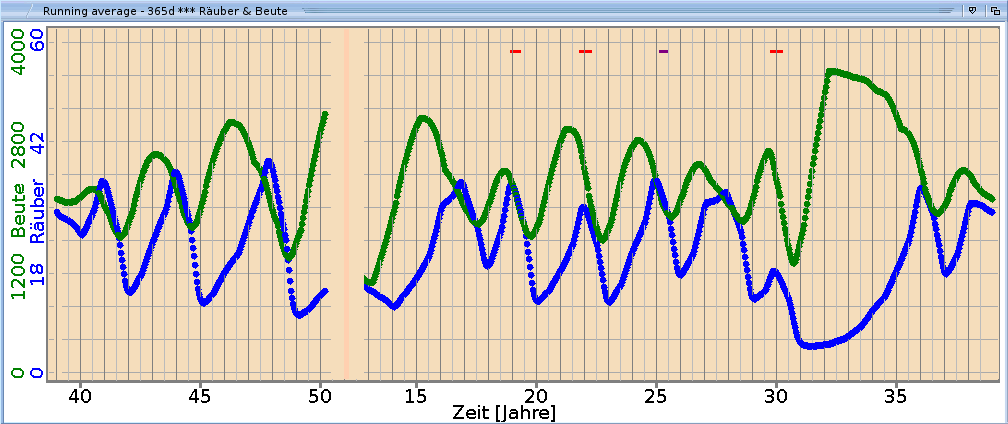
The example screen shot shown here demonstrates many of the properties: There is an "Icewinter" (indicated by the thick black horizontal line), a rather small virus outbreak (indicated by the thin purple horizontal line) is affecting the predator population. Also, indicated by the thin red horizontal line, a virus outbreak lethally for prey is shown. The example shown demonstrates the interrelation of a prey virus and the predator population nicely. The 2nd graph shows a running average of the predator prey population for a continuous year period (365 days) year and may look like this: |
|
Again, green denotes the prey population and blue the predator population. Each 2nd thin
vertical line (dark grey) denotes a year, the window hence
has a drawing space for about 38 years. It is a continuous plot. The vertical resolution is of
the same ratio as at the population dynamice window for prey while each horizontal line
distance equals to 6 predator individuals here. At top of the plot thin horizontal
lines indicate average times when a virus was affecting the population.
The running average is good for long time observations and shows the Lotka-Volterra properties quite nicely (lagging maxima and minima time positions between prey and predator population). The thinner and lighter lines denote values from a running average over a 5 year time period. Should help to monitor the 2nd Lotka-Volterra law. Grab a copy for your particular system from here:
V1.5 - Download (Windows version)
V1.4 - Download (Hollywood player applet) Except for Windows the archives are packed with lha. That's a common packer on MorphOS (my development system) and AmigaOS. Most systems should have no problem to decrunch the archive - at least Winzip® >V11.1 is able to decrunch it.
Versions for Linux (x86, ARM or ppc), OS X (x86 or ppc), AROS (x86) and OS4 (ppc) are yet available on request only. Please mail for a copy. On the running average window the very first two data points (one for for prey and one for predator) seem a bit strange Well, that's a minor flaw I was too lazy yet to cover. Maybe next release... I don't like dictatorship and want to save my data elsewhere than the program forces me...? As of yet there's no way to change saving location. Will get changed with a next version. I found a bug, want to discuss the data or algorithm, have a feature request or want to donate you a bag of gold ducates? Well, in that case don't hesitate to contact me.
Windows says this program is potentially dangerous
On Android the program crawls! There's nothing to denay, it acually does. At least the graphics. The way the graphic ouput is implemented with this version is not optimized on Android... --
V1.5 released on 01.07.2025
V1.4 released on 20.02.2019
V1.3 released on 26-Oct-2015
V1.2.3 released on 24-Sep-2015
V1.2.2 released on 24-June-2015
V1.2.1 released on 15-May-2015
V1.2 released on 08-May-2015
V1.1 released on 23-Apr-2015
V1.0 released on 02-Dec-2014
back to main page and contact information
© 1999-2025 U.Beckers Alle Warenzeichen sind Eigentum ihrer jeweiligen Rechteinhaber. Alle Angaben unter Vorbehalt. Impressum: Webmaster und verantwortlich für alle Inhalte auf dieser Seite: Ulrich Beckers, Angenetestr. 44, 33332 Gütersloh mailkontakt: u l r i c h . b e c k e r s |at| w e b . d e |